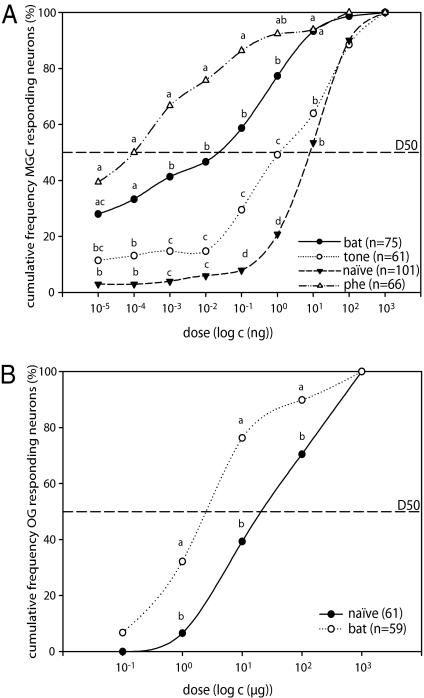
Fig. 3.
Cumulative frequency curves of response thresholds of AL neurons in S. littoralis males. (A) Cumulative response threshold distribution of MGC neurons to the main pheromone component, EZ-9,11–14:OAc. Mainly neurons with a high threshold were found in naive and tone-exposed males, whereas lower threshold neurons were found in males that had been preexposed to pheromone or bat sound. The D50 is indicated as a dashed line. Neurons in pheromone- and bat-exposed males reached the D50 at lower doses than in tone-exposed and naive males. (Bat, neurons in bat sound-exposed males; tone, neurons in tone-exposed males; phe, neurons in pheromone-exposed males.) (B) Cumulative response threshold distribution of OG neurons to flower odors. For each neuron the lowest threshold for the best-tuned compound out of the three tested odors (linalool, geraniol, and heptanal) was determined. Neurons in bat-exposed males had lower thresholds than neurons in control males. Statistical differences among treatments were assessed for each individual dose by means of a G-test for independence and pairwise post-hoc comparisons. Numbers in brackets indicate numbers of tested neurons. Different letters denote statistical differences (α′ = 0.008).

