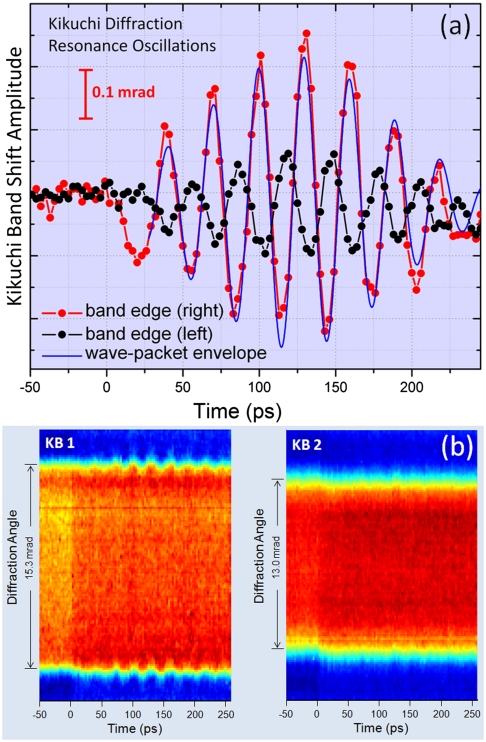
Fig. 4.
Ultrafast spatiotemporal behavior of Kikuchi diffraction. (A) Shown is the observed resonance oscillations of intensity at the two edges of the KB1 band. The resonance at 33 GHz with a wave-packet-like envelope clearly displays the out-of-phase characteristic of the transverse motion for the atoms at the top and bottom surfaces of the acoustic waveguide. Time zero was determined by the intensity drop of a HOLZ reflection (see text). The red amplitude scale corresponds to the band edge (Right) curve. The difference in amplitudes between the two edges is due to dynamical scattering that is present at the low scattering angles and where this edge was measured. The apparent shape is also reminiscent of the superposition of group of vibrational modes (30), but because the time zero was established, the rise of both transients with the same value at t = 0 excludes such proposition. (B) Temporal behavior of two Kikuchi bands displaying the presence (KB1) and absence (KB2) of the oscillatory resonance. The bands’ cross-sections were taken close to the Laue-zone ring for better contrast. From the left image, the amplitude of the shifting oscillation can be measured directly.

