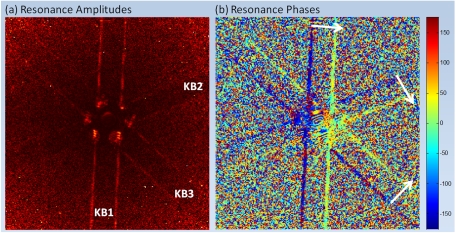
Fig. 5.
Fourier analysis images of phases and amplitudes at the resonance frequency. Shown are (A) resonance amplitude and (B) phase images at 33 GHz, obtained by the Fourier transform of the convergent beam ultrafast electron diffraction frames (Fig. 3). It is clear from image A that the KB1 band oscillates with the highest amplitude, whereas KB2 and KB3 display significantly less amplitude oscillations. The phase image (B) confirms the out-of-phase behavior of the bands’ edges. Moreover, the white arrows indicate the relative movements of the bands, which are readily used to derive the polarization direction of the elastic waves (see text). The scale bar, which is in degrees, is for the phase image.

