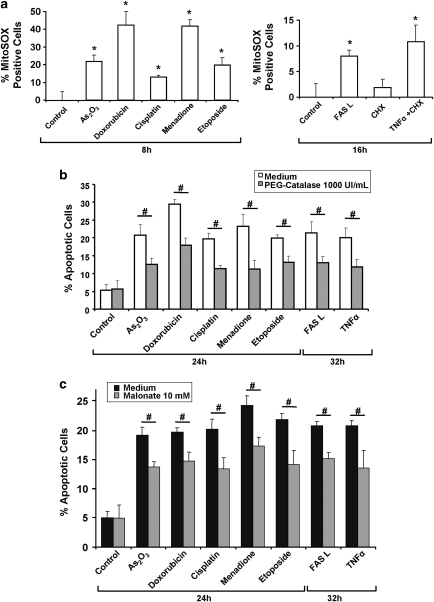
Figure 2.
Involvement of ROS in apoptosis induced by various apoptotic signals. (a) Effects of the different anticancer drugs and cytokines on mitochondrial ROS production. HeLa cells were treated with the indicated drugs (8 h) or cytokines (16 h), at the concentrations shown in Supplementary Table 1. ROS were quantified by flow cytometry through MitoSOX-related fluorescence. (b, c) Effects of the ROS scavenger PEG-catalase (b) and the SDH inhibitor malonate (c) on apoptosis induced by the different agents. HeLa cells were treated with the compounds for the indicated times and apoptosis was measured by flow cytometry using PI staining of the sub-G1 population. *P<0.05 compared with the related control; #P<0.05

