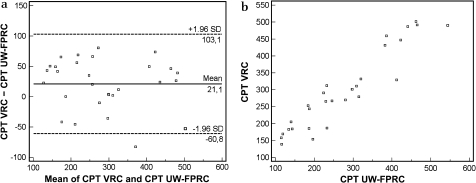
Figure 1.
(A) Blant-Altman plot comparing mean and difference of manually re-measured centre point thickness (CPT) values between the two reading centres. (B.) Scatterplot of manually re-measured CPT values from the two reading centres. UW-FPRC, University of Wisconsin-Madison Reading center; VRC, Vienna Reading Center.

