
Fig. 5.
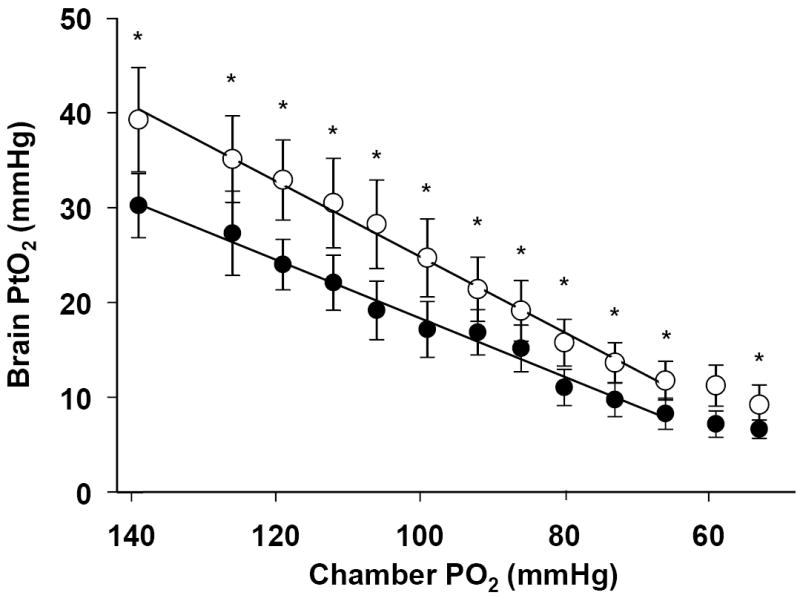
The relationship between PtO2 and inspired O2 before and after acclimatization. (a) A linear regression is fit through the data, not including the final 2 points at low values of inspired O2. Black circles, pre-acclimatization, r2=0.98, Open circles, post acclimatization. r2=0.99. The slopes of the curves before and after acclimatization are 0.31 and 0.37 respectively. The slopes are significantly different (p<0.001)(mean ± S.E. p≤ 0.01). Two way ANOVA with a Holm-Sidak post-hoc method was used to test for changes at each FiO2 between pre- and post-acclimatization (* indicates significance, p < 0.05).