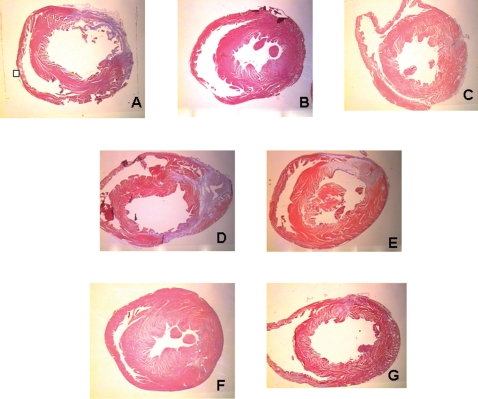
Figure 4.
Representative transversal sections showing the scar size in different groups. Stained with Masson trichrome. The scar (rich in collagen) is shown in purple and the non-infarcted ventricle is shown in pink. (A) Control group; (B) exercise training group; (C) morphine group; (D) exercise training plus naloxone group; (E) morphine plus naloxonegroup; (F) exercise training plus morphine group; (G) intermittent ischemia-reperfusion group.

