
Figure 7. Live Imaging of MADM-Labeled Ndel1−/− Cortical Projection Neurons.
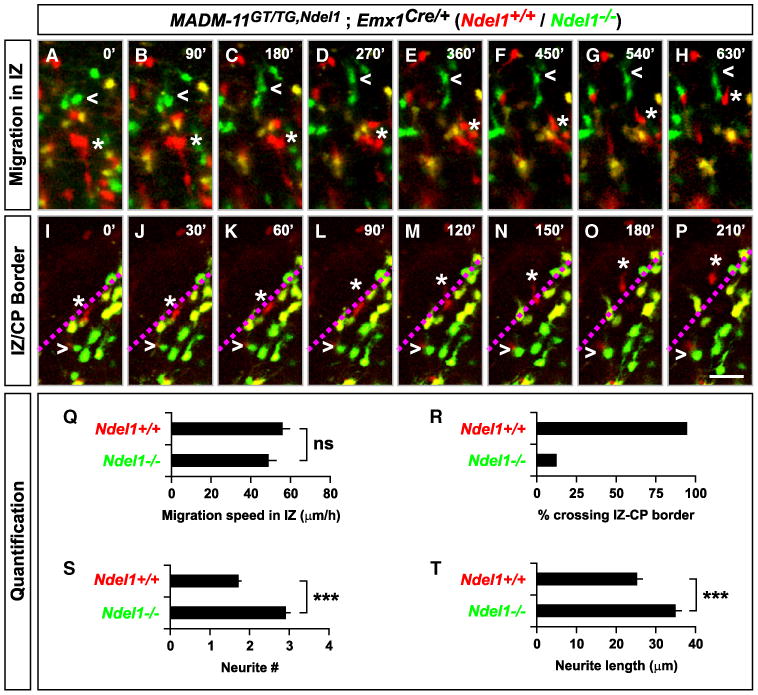
(A–P) Time-lapse images of migrating cortical projection neurons in the IZ (A–H) and at the border to the CP (I–P) in organotypic cortical slices derived from Ndel1-MADM (MADM-11GT/TG,Ndel1;Emx1Cre/+) mice at E14.5. Open arrowheads mark Ndel1−/− cells (GFP, green) and stars mark Ndel1+/+ control cells (tdT, red). The border between the IZ and CP is indicated as dotted line in magenta (I–P). Frames are every 90′ (A–H) and 30′ (I–P). Scale bar, 50 μm (A–H); 40 μm (I–P). (Q–T) Quantification of (Q) migration speed in IZ (n = 33 each for Ndel1+/+ and Ndel1−/− cells each); (R) fraction of labeled cells crossing the IZ-CP border (n = 19, 24 for Ndel1+/+ and Ndel1−/− cells, respectively); (S) number of neurite branches (n = 58 each for Ndel1+/+ and Ndel1−/− cells); (T) neurite length of migrating cells in IZ (n = 51, 65 for Ndel1+/+ and Ndel1−/− cells, respectively). Values in (Q), (S), and (T) represent mean ± SEM; ns, nonsignificant; ***p < 0.001. See also Figure S7 and Movies S1 and S2.