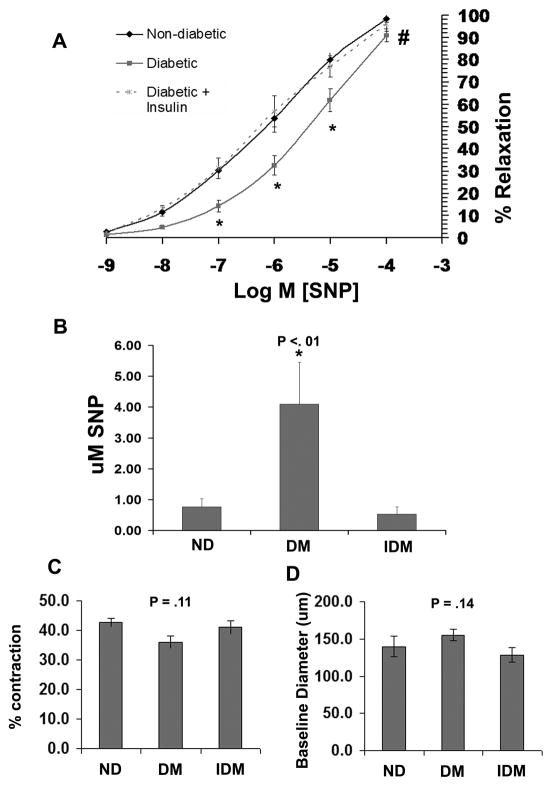
Figure 2. Type I Diabetic swine have impaired coronary microvessel dilation to the NO donor SNP.
A) SNP dose response curves of coronary microvessels following preconstriction with U46619 from ND, DM and IDM swine. B) Mean EC50 values of microvessel responses to SNP determined from the individual curves used to generate A. C) The % contraction (relative to baseline diameter) of ND, DM, and IDM coronary microvessels to 1 uM U46619. D) Baseline diameter of coronary microvessels before preconstriction with U46619. * indicates p<.05 vs ND, One Way ANOVA, and # indicates p<.05 for dose response curves versus ND, Two Way RM ANOVA.

