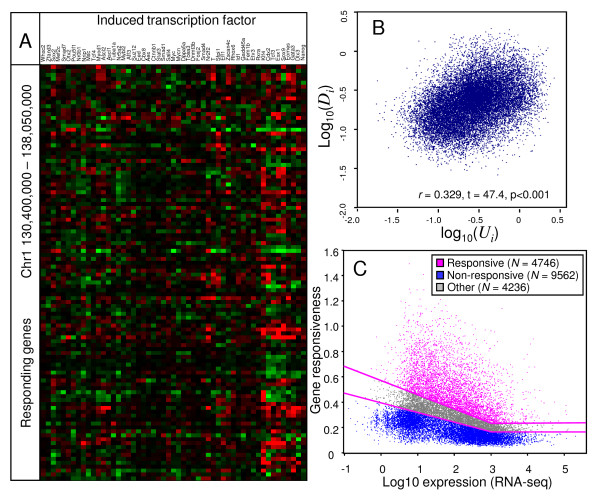
Figure 1.
TF-responsiveness of genes in ES cells. (A) A heatmap of gene response to the induction of 50 transcription factors and 3 other genes in ES cells; responding genes are plotted in the order of their genome locations in chr1:130,400,000-138,050,000, as listed in Additional File 2. (B) Correlation between log-transformed TF-responsiveness of genes for upregulation and downregulation. (C) TF responsiveness plotted against log-expression of genes estimated from published RNA-seq data [19]; groups of responsive, non-responsive, and borderline genes are shown by color.

