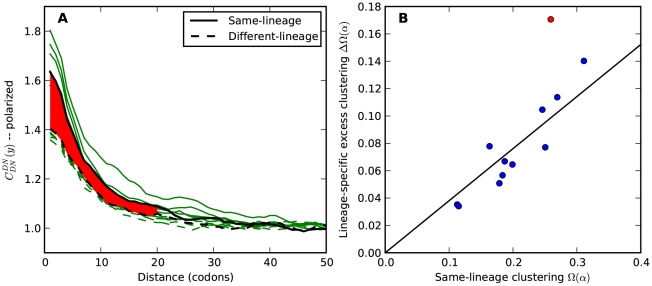
Figure 4. Lineage-specific clustering of amino acid substitutions.
A)  estimated from substitutions that arose in the same lineage as the focal substitution (solid black line) and from substitutions that arose in a different lineage then the focal substitution (dashed black line) for the species comparison of D. yakuba to D. melanogaster. Substitutions were polarized (assigned to the lineage in which they arose) by parsimony using D. anannasae as outgroup. Lineage-specific excess clustering,
  Dyak
Dyak , is defined as the area between these curves over the first
  codons, shaded in red, multiplied by the overall substitution density in the Dyak lineage. The green plots in the background are the analogous cPDFs estimated from the other species comparisons we considered (solid lines are same-lineage cPDFs, dashed lines different-lineage cPDFs). Clustering within the same lineage is stronger than that between lineages for every lineage we consider. B) The clustering attributable to a lineage-specific mechanism
  is plotted as a function of the total clustering within a lineage
  for each lineage included in our study. A one parameter linear fit line is included with slope
  , indicating that roughly one-third of the clustering within a lineage appears to arise from lineage-specific mechanisms such as compensatory or synergistic mutations, adaptive bursts and/or hitchhiking. The D. simulans result indicated in red is excluded from the fit as an outlier.

