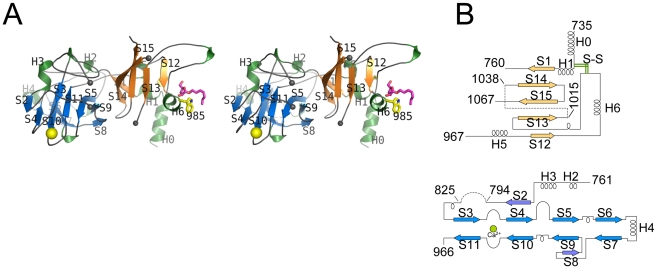
Figure 2. Stereo diagram of EmbCCT and topology of its subdomains.
A) Stereo ribbon diagram of EmbCCT with definition of the secondary structure elements. Grey spheres indicate the boundaries of the disordered loops. The Ca2+ ion (yellow sphere), and positions of Trp985 (yellow sticks) and of the Ara(1→5)Ara-O-C8 ligand (magenta) are shown. B) Topology diagrams of subdomains I (top) and II (bottom), illustrating the connectivity of secondary structure elements and the jelly roll topology of subdomain II.

