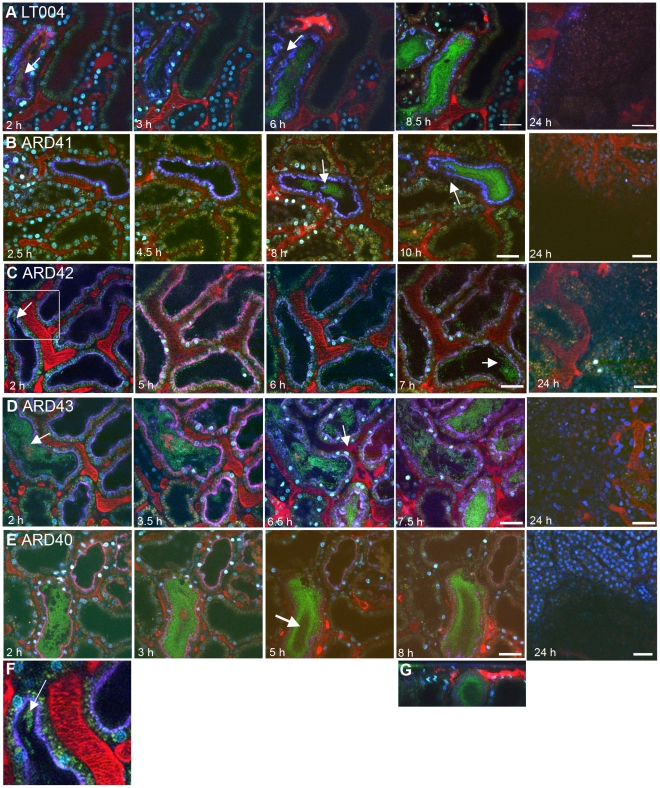
Figure 3. Progression of infection in live animals.
Multiphoton imaging of renal tissue after infusion of indicated strains (green). Injected proximal tubules are outlined by a co-injected 10 kDa cascade-blue dextran (blue); blood plasma is labeled with 500 kDa rhodamine dextran (red) and cell nuclei are stained with Hoechst 33342 (cyan). (A) Wild type LT004 bacteria (green, arrow) (n = 12) can be seen colonizing the infected tubule (blue outline) within 2 h. As bacteria multiplied, shutdown of the peritubular capillaries was observed by a loss of the red plasma marker within surrounding capillaries (arrow, 6 h). (B) The UPEC strain ARD41, which lacks PapG mediated attachment, showed compromised colonization kinetics with few bacteria visible before 8 h (arrow). At 10 h, bacteria colonized the tubule lumen and signs of vascular dysfunction appeared (arrow) (n = 12). (C) The E. coli K-12 strain ARD42 (n = 5) showed a delayed colonization, with few bacteria colonizing the tubule at 2 h (arrow and insert, which is shown as Figure 3F). Colonization at 7 h was less as compared to LT004 (arrow). (D) Expression of P fimbriae in strain ARD43 restores colonization kinetics. Arrow at 2 h identifies bacterial colonization. At 6.5 h the beginning of vascular dysfunction can be seen by the lack of black shadows typical of flowing erythrocytes (arrow) (n = 4). (E) Lack of FimH mediated attachment in UPEC strain ARD40 shows that bacteria struggle to maintain themselves in the center of the tubule lumen, with less bacteria in the center of the tubule (arrow 5 h) (n = 7) (F) 50 µm wide inset from Figure 3C showing bacterial colonization of the tubule. (G) shows x-z projection of panel 3E, ARD40 8 h, demonstrating the bacterial ‘tube’ structure. Images from 24 h show bacterial clearance and edema formation in all strains. Scale bars: 7–10 h = 30 µm, 24 h = 50 µm. All figures presented are representative images, displaying the characteristic colonization patterns for each experimental set.

