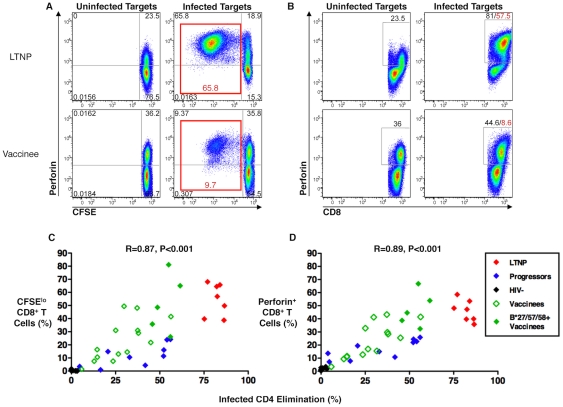
Figure 4. HIV-specific CD8+ T-cell proliferation and perforin expression correlated with cytotoxic capacity in recipients of an Ad5/HIV vaccine.
(A, B) Flow cytometry plots of a representative LTNP (top row) and Ad5/HIV vaccine recipient (bottom row) depicting CD8+ T-cell proliferation (A) and CD8+ T-cell perforin expression (B) following 6-day stimulation of CFSE-labeled PBMC with uninfected (left columns) or HIVSF162-infected (right columns) autologous CD4+ T-cell targets. Plots are gated on CD8+ T-cells. Net HIV-specific CD8+ T-cell proliferation (sum of upper left and lower left quadrants in A, right column) and net CD8+ T-cell perforin expression (as determined by subtracting background perforin expression measured in cells that had been stimulated with uninfected targets; B, left column) are shown in red font. (C, D) Summary data of CD8+ T-cell proliferation (C) and perforin expression (D) are shown for LTNP (red symbols, n = 7), progressors (blue symbols, n = 10), HIV-negative individuals (black symbols, n = 10) and Ad5/HIV vaccinees (green symbols, n = 19), including 5 individuals carrying the protective HLA class I alleles B*27, B*57 or B*58 (solid green symbols). Data are representative of at least two experiments. Statistical analyses were performed using the Spearman correlation.

