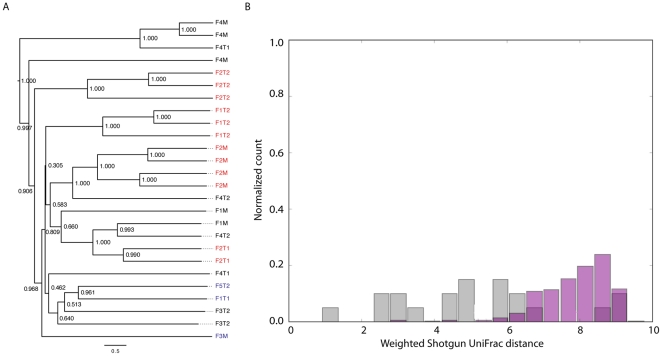
Figure 3. (a) UPGMA clustering of individuals by weighted Shotgun UniFrac distances between metagenomes.
Cases where metagenomes from a single individual cluster monophyletically are highlighted in red. Cases where only a single metagenome for an individual was included are highlighted in blue. 1000 jackknife iterations were performed at a depth of 200 sequences per metagenome, and jackknife support values are provided for each node. The Reyes et al. analysis from which these samples were derived studied gut microbial communities from human twins and their mothers. The labels for each sample indicate the individual where: Fn corresponds to family number n; M corresponds to mother; and T1 and T2 refer to twin 1 and twin 2, respectively. (b) Histograms of within individual (grey) and between individual (pink) Shotgun UniFrac distances.

