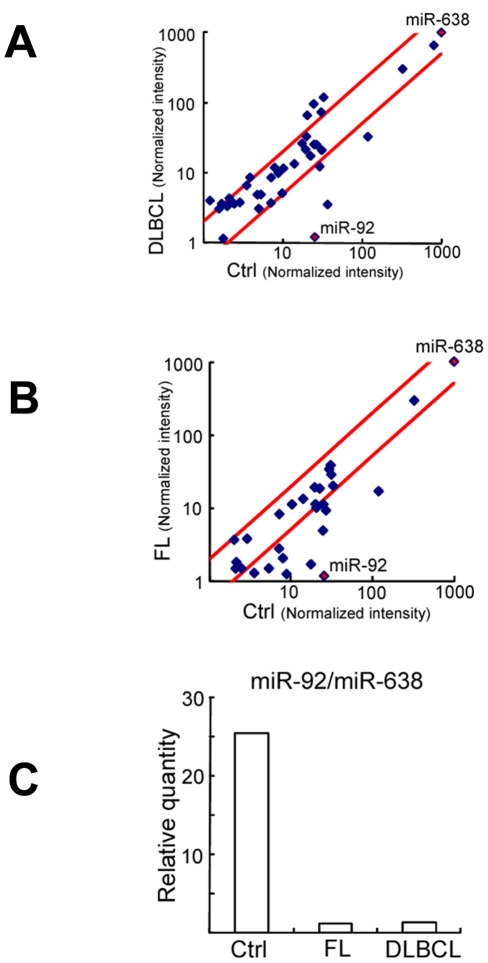
Figure 1. Comparison of miR expressions in the plasma of normal subjects and non-Hodgkin's lymphoma patients by MiRNA microarray.
Comparison of normalized signal intensities of various miRs in plasmas (miR-638 adjusted to 1000). X axis represents healthy control (Ctrl), and Y axis represents diffuse large B-cell lymphoma (DLBCL) (A) or follicular lymphoma (FL) (B). Red squares show miR-638 (control) and miR-92a. (C) Comparison of the ratio of miR92/miR-638 signal intensity in the plasma of Ctrl, FL, and DLBCL.

