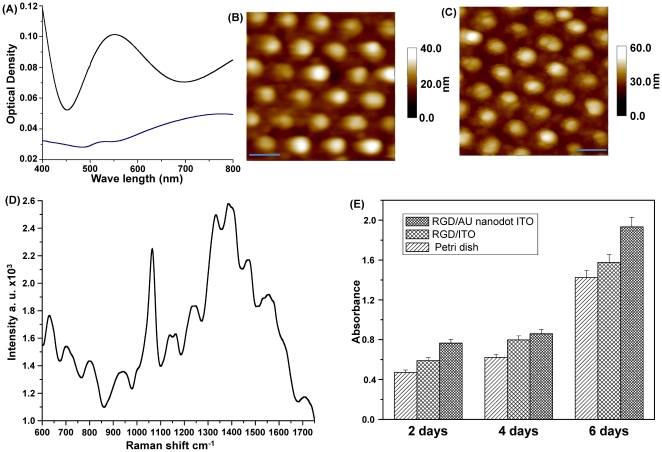
Figure 2. Validation of the substrate as a cell-based chip.
(A) Surface plasmon absorption spectra of the Au NP array (blue line) and the Au nanodot array (black line). (B) AFM image of the Au nanodot/ITO substrate. (C) AFM image of RGD-peptide immobilized on the Au nanodot/ITO substrate. Scale bar: 100 nm. (D) Raman spectrum of an RGD-peptide immobilized on the Au nanodot/ITO. (E) Proliferation rate of HMEC cells determined via an MTT assay as a function of absorbance until day 6.

