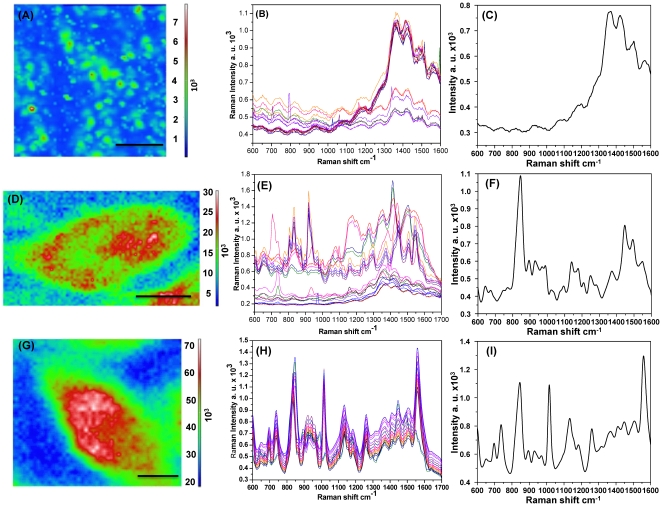
Figure 3. SERS mapping image and spectra of HEK 293T cells.
(A) SERS map image of cells incubated with colloidal Au NPs. (B) SERS spectra from twenty different points inside the cell nucleus incubated with colloidal Au NPs. (C) Mean SERS spectrum of twenty spectra at different points inside the cell nucleus incubated with colloidal Au NPs. (D) SERS map image of cells immobilized on the randomly distributed Au NP array. (E) SERS spectra from twenty different points inside the cell nucleus immobilized on the Au NP array. (F) Mean SERS spectra of twenty different points inside the cell nucleus immobilized on the Au NP array. (G) SERS map image of cells immobilized on the homogenous Au nanodot array. (H) SERS spectra of twenty different points inside the cell nucleus immobilized on the Au nano-dot array. (I) Mean SERS spectra of twenty different points inside the cell nucleus immobilized on the Au nano-dot array. Scale bar: 10 µm.

