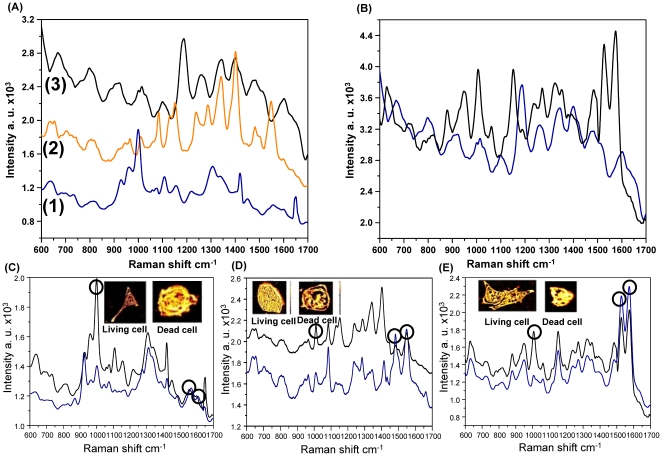
Figure 4. SERS spectra of different cell lines.
(A) SERS spectra of (1) HeLa, (2) HepG2, and (3) MCF-7 cells. (B) SERS spectra of (blue) MCF-7 and (black) HMEC cells. (C) SERS spectra of living HeLa cells (black curve) and dead HeLa cells (blue curve). Inset contains the confocal microscopic images of living and dead HeLa cells. (D) SERS spectra of living HepG2 cells (black curve) and dead HepG2 cells (blue curve). Inset contains the confocal microscopic images of living and dead HepG2 cells. (E) SERS spectra of living HMEC cells (black curve) and dead HMEC cells (blue curve). Inset contains the confocal microscopic images of living and dead HMEC cells. Circles in Figs. C, D, and E indicate the primary differences between the SERS spectra of living and dead cells.

