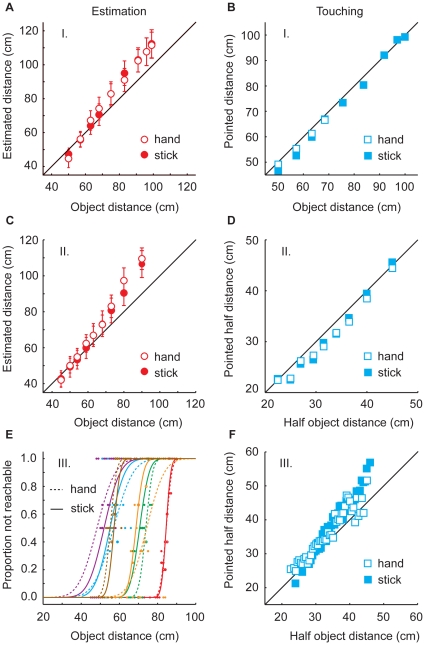
Figure 3. Data of the estimation and touching trials in the three sessions.
Session 1 (A, B), session 2 (C, D) and session 3 (E, F). Open symbols and dotted lines represent data from the hand block and filled symbols and solid lines show the data from the stick block. Each color in figure 3E represents one subject. Error bars represent between-subject standard errors.

