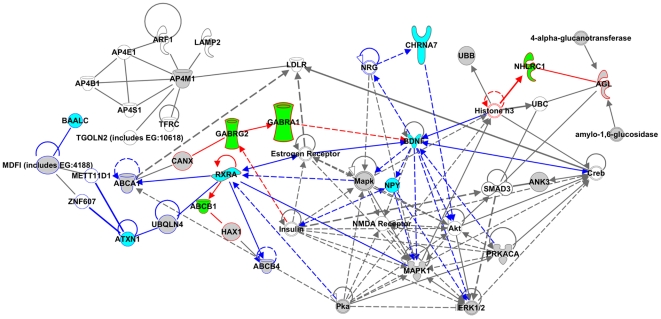
Figure 2. Molecular network of high-priority genes.
Shaded nodes are genes from both CNV and HuGE networks. Green nodes are annotated in association with epilepsy. Cyan nodes are annotated in association with schizophrenia. Red edges are from epilepsy nodes to nearest-neighbors. Blue edges are from schizophrenia nodes to nearest-neighbors.

