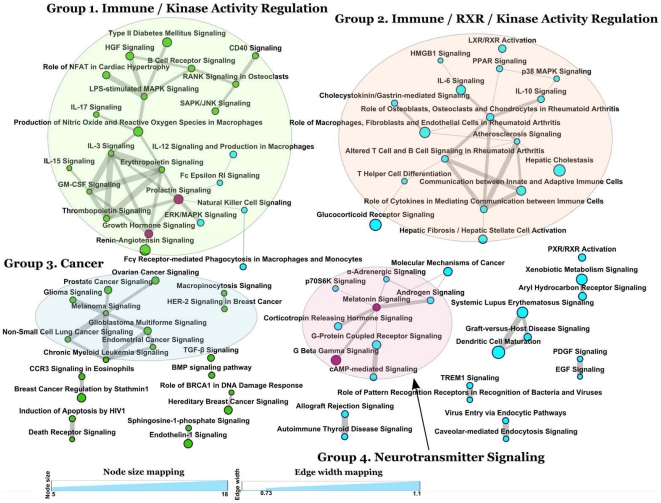
Figure 3. Pathway crosstalk and functional map of the CNV-subnetwork and HuGE-subnetwork.
We indicate each pathway as a gene set. Significant pathways (nodes) are connected based on their overlap of component genes and are represented as edges. Node color indicates gene set membership, i.e., green pathways are enriched in the CNV-subnetwork; blue pathways are enriched in the HuGE-subnetwork; purple pathways are enriched in both subnetworks. Node size is proportional to the total number of encoded proteins of CNV-genes and HuGE-genes mapped in each pathway. Edge width is proportional to the overlap score of the related pathways (see Materials and Methods). The legend in the bottom shows the node size (i.e., the number of interesting proteins in each pathway) and edge width (i.e., the extent of the overlap between two nodes).

