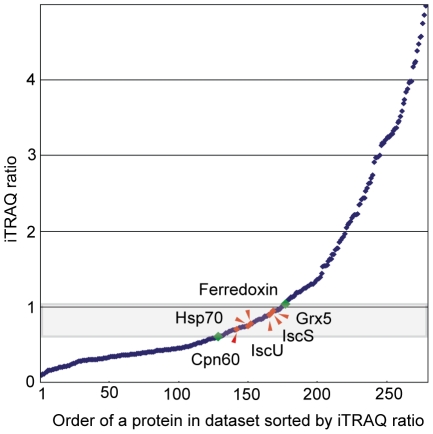
Figure 2. iTRAQ ratios define protein subcellular localization.
Proteins in fractions #3 and #4 isolated on the Optiprep gradient were labeled with the iTRAQ-114 and iTRAQ-115 reagents, respectively, analyzed by LC MS/MS, and sorted according to the iTRAQ ratios. Mitosomal marker proteins (red diamonds) fall into a narrow range of iTRAQ ratios. Green diamondsdindicate the zone of proteins considered as mitosomal candidates (mitosomal distribution, MiD).

