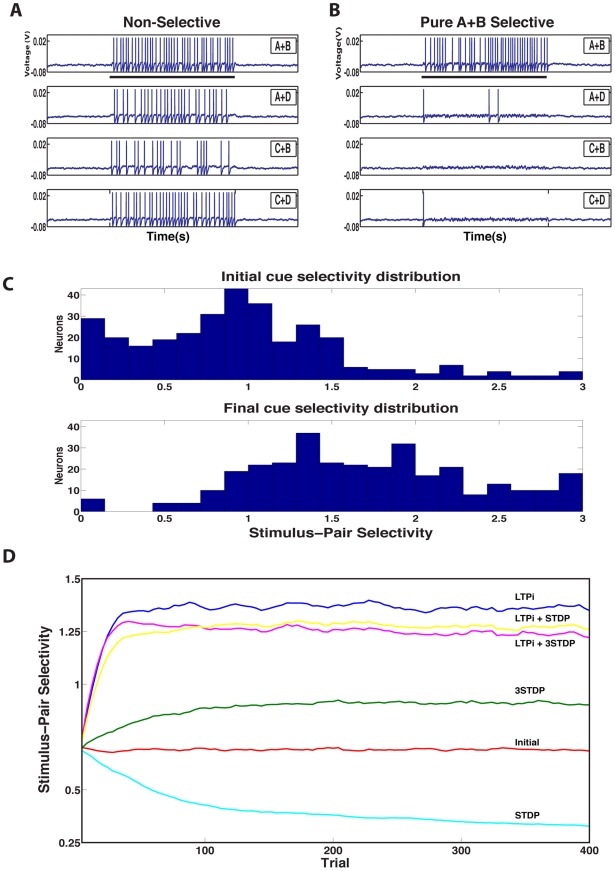
Figure 2. Stimulus-pair selectivity from the single neuron to the network level.
Response of a single neuron to stimulus-pairs cues (A black bar underneath the figure represents cue presentation time of 1 s) before learning (A) and after learning (B). Initially, by chance, each neuron may be more responsive to some stimulus pairs than others, leading to a non-zero level of simulus-pair selectivity. C. Distribution of stimulus-pair selectivity across the network before learning (above). Following learning with LTPi and triplet STDP (below), there is a rightward shift in the population stimulus-pair selectivity distribution, indicating that the population as a whole is moving from non-selective to strongly stimulus-pair selective. We normalize this metric by the rate, which produces a maximum stimulus-pair selectivity value of 3. D. The mean population stimulus-pair selectivity distribution is plotted as a function of trial. In this network (with 6 input groups per stimulus and base input connection probability = 1/3), neither triplet (green) nor standard STDP (cyan) generate significant selectivity. However, if LTPi is added to standard STDP (yellow) or triplet STDP (magenta), strong selectivity emerges, and even stronger selectivity is observed during training with LTPi alone (blue).

