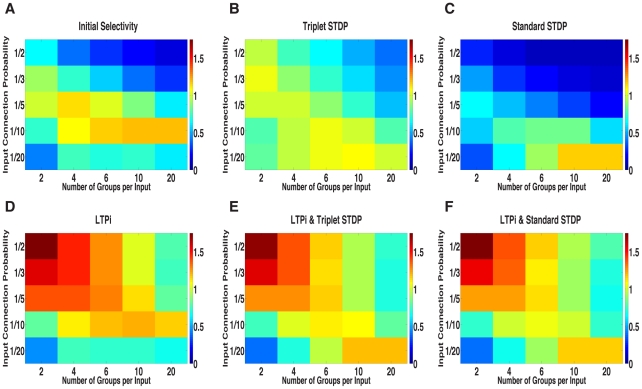
Figure 4. Network mean stimulus-pair selectivity.
Each matrix contains the results for 25 networks, with 5 levels of input correlation (x-axis) and 5 levels of sparseness (y-axis) in one of six conditions: A. Before learning. B–F. following 800 trials with plasticity. B. after triplet STDP. C. after standard STDP. D. after LTPi alone. E. after triplet STDP+LTPi. F. after standard STDP+LTPi.

