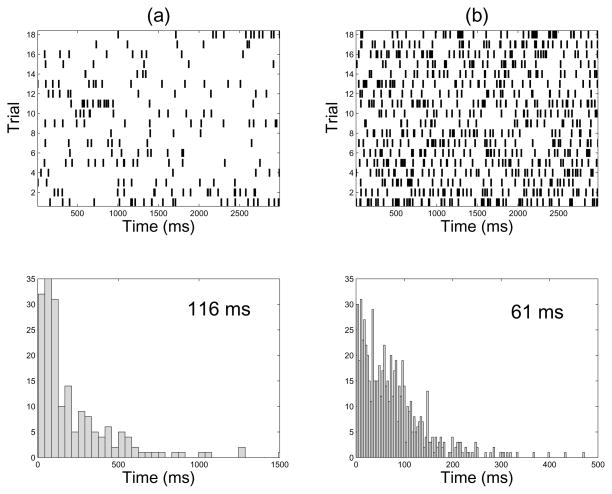
Figure 6.
Spike rasters and inter-spike interval (ISI) histograms of two representative M1 neurons (Dataset-1): (a) a RS neuron (mean firing rate: 3.7 Hz), (b) a FS neuron (mean firing rate: 13 Hz). The legends in the ISI histograms denote the median ISI values. One-sample KS test indicated that these two ISI samples are not exponential distributed (P > 0.05).

