Figure 1.
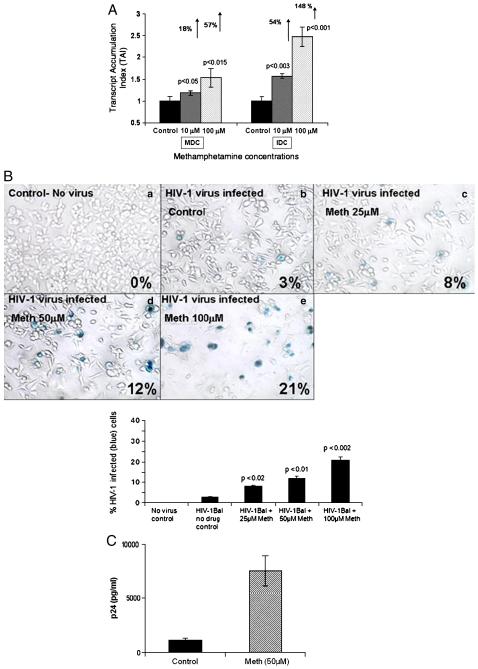
Figure 1A: Meth enhances HIV-1 replication. MDC and IDC (5×10⁵ cells/ml) were infected with native HIV-1 IIIB (X4) (NIH AIDS Research and Reference Reagent Program Cat# 398) at a concentration of 10 3.0 TCID 50/ml cells overnight and washed 3 times with Hank's balanced salt solution (GIBCO-BRL, Grand Island, NY) before being returned to culture with and without Meth (10 & 100 μM) for 24 hr. The RNA was extracted, reverse transcribed and followed by quantitative real time PCR against the LTR-RU5 and the housekeeping gene, β-actin and the 18S RNA primers as internal controls. The data represent mean ± SD of 3 independent experiments. Statistical analysis was done using Student's ‘t’-test.
Figure 1B: Meth enhances HIV-1 infectivity as measured by MAGI assay. MAGI cells (4×10⁴ cells/well) were plated in a 24 well plate, and were treated in duplicate with a 100 μl supertanants from MDC that have been infected with HIV-1 IIIB virus and treated with or without Meth. A total of 200μl of DMEM supplemented with 10% FCS, 100 U/ml penicillin, 100μg/ml streptomycin, 0.25μg/ml fungizone and 300μg/ml glutamine containing DEAE-DEXTRAN at a concentration of 15mg/ml was added to the MAGI cells and infected cells were incubated for 3 days at 37°C, 5%CO2. Cells were fixed and stained with 5-bromo-4-chloro-3-indolyl-D-galactopyranoside (X-Gal) and blue cells were counted as infected cells. The graph represents the percentage of infected cells in each treatment group as observed using a 20X inverted Nikon microscope.
Figure 1C: Meth enhances p24 production. MDC (5×10⁵ cells/ml) from normal subjects were infected with native HIV-1 IIIB (NIH AIDS Research and Reference Reagent Program Cat# 398) at a concentration of 10 3.0 TCID 50/ml cells overnight and washed 3 times with Hank's balanced salt solution (GIBCO-BRL, Grand Island, NY) before being returned to culture with and without Meth (50μM) for 14 days. The culture supernatants were quantitated for p24 antigen using a p24 ELISA kit (ZeptoMetrix Corporation, Buffalo, NY). The data represents the mean ± SD of 3 independent experiments and is expressed as pg/ml. Statistical analysis was done using Students' ‘t’-test.

