Figure 5.
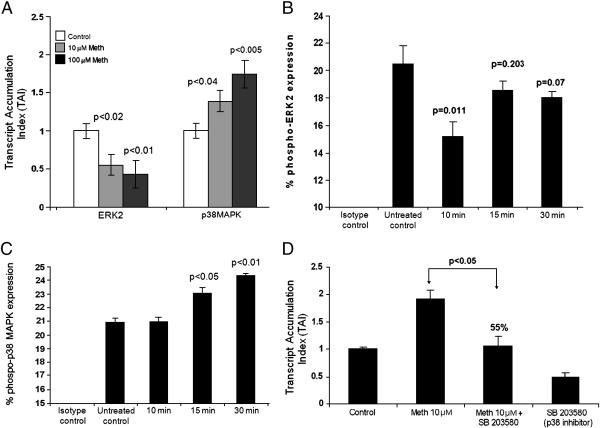
Figure 5A: Meth differentially regulates signal transduction molecules in MDC. MDC (5×10⁵ cells/ml) were cultured for 24 hr with and without Meth (10 & 100μM), RNA was extracted, reverse transcribed and QPCR amplified against various signal transduction molecules ERK2 and p38 MAPK. The data represent mean ± SD of 3 independent experiments. Statistical significance was determined by Student's ‘t’- test.
Figure 5B: Effect of Meth on the phosphorylation of ERK2. MDC (~ 5×10⁵ cell/ml) were treated with Meth (100μM) for 10, 15, and 30 min following which FACS analysis was done to determine the percentage of cells expressing phosphorylated ERK2. Statistical significance was calculated by Student's ‘t’-test. The histogram is a graphical representation of 3 independent FACS experiments.
Figure 5C: Effect of Meth on the phosphorylation of p38 MAPK. MDC (~ 5×10⁵ cell/ml) were treated with Meth (100μM) for 10, 15, and 30 min following which FACS analysis was done to determine the percentage of cells expressing phosphorylated p38 MAPK. Statistical significance was calculated by Student's ‘t’-test. The histogram is a graphical representation of 3 independent FACS experiments.
Figure 5D: p38 MAPK inhibitor reverses Meth induced upregulation of CCR5 gene expression. MDC (5×10⁵cells/ml) were cultured alone or with Meth (10μM) or the p38 MAPK inhibitor (SB203580) (10μM) alone and in combination with Meth (10μM) plus inhibitor (SB203580) (10μM) for 24 hr and CCR5 specific mRNA expression was quantitated using real time PCR. The data represent mean ± SD of 2 independent experiments. Statistical analysis was done using ANOVA.

