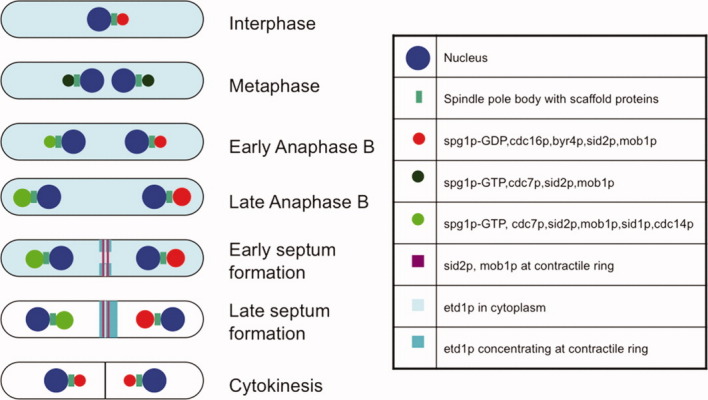
Fig. 3. Localization of SIN proteins during interphase and mitosis.

The cartoon depicts the localization of the core SIN proteins during mitosis and cytokinesis. The size of the circles associated with the SPB is meant to represent the intensity of the signal that is observed. For the sake of clarity, the localization of regulatory proteins is not shown: see Lattmann et al. [2009]; Simanis [2003] for additional details.
