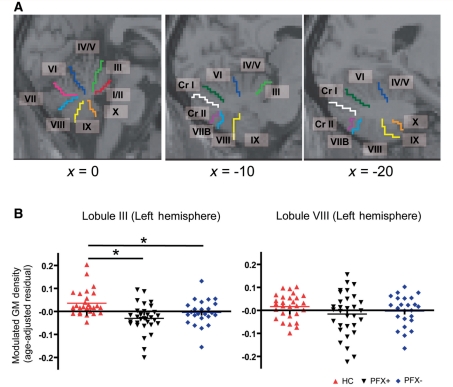
Figure 2.
Region of interest analyses of the cerebellar subregions. (A) Sagittal views showing cerebellar subregions as determined by the WFU PickAtlas (Maldjian et al., 2003). In the most medial section (x = 0), the eight subregions in the vermis are shown (lobules I/II, III, IV/V, VI, VII, VIII, IX and X). The nine subregions in the hemisphere (lobules III, IV/V, VI, VIIB, VIII, IX, X, Crus I and Crus II) are shown in the lateral sections (x = −10 and x = −20). (B) Comparisons of grey matter (GM) density among the three groups in selected cerebellar subregions. Significant difference between two groups is shown by an asterisk. The y-axis represents the residual from a linear regression of age over the mean modulated grey matter density extracted from each subregion.

