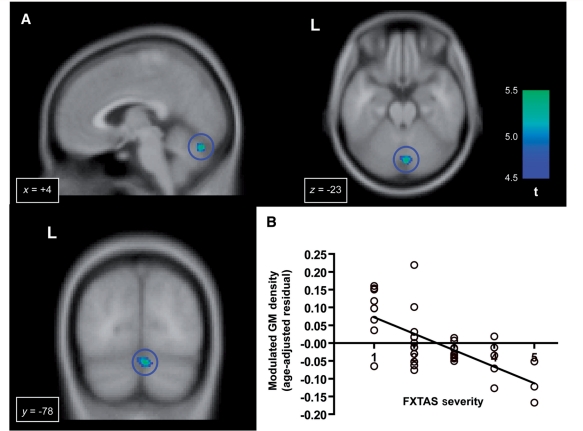
Figure 5.
Progressive grey matter (GM) loss correlated with the severity of FXTAS. (A) Significant negative correlation with a clinical scale for assessment of the FXTAS severity in the vermis (shown in the blue circles). (B) The plot of the FXTAS severity and the grey matter density at a voxel of the highest t-value in the vermis (x, y, z = 4, −78, −23).

