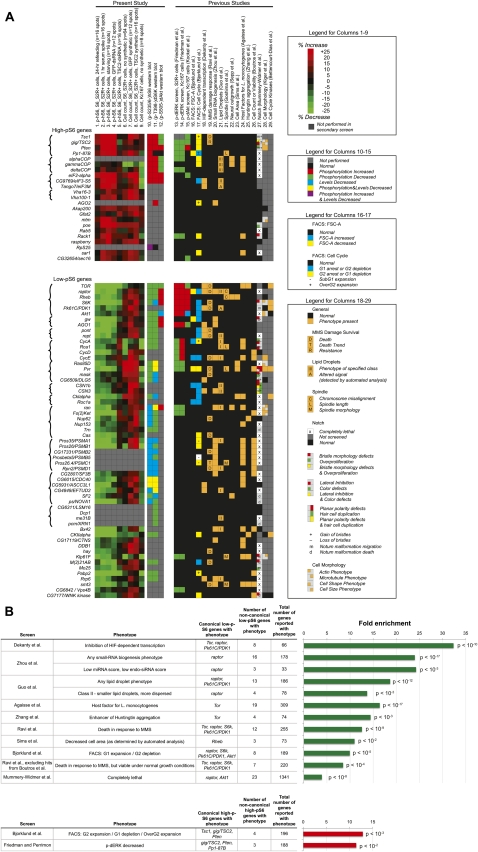
Figure 8.
Meta-analysis of present study and prior related RNAi screens. (A) Columns 1–9 summarize the results of our secondary screens (as previously shown in Fig. 4), columns 10–12 indicate the results of our Western blot experiments, and columns 13–29 describe these genes' performance in other screens according to the legends shown. (B) Analysis of other studies' gene groups. Groups of genes are shown if they contained at least one canonical TORC1 pathway gene and are also significantly enriched among the 51 low-pS6 and 19 high-pS6 genes in our screen. The hypergeometric P-value of the fold enrichment is shown; it has been corrected for multiple comparisons (Benjamini and Hochberg 1995).

