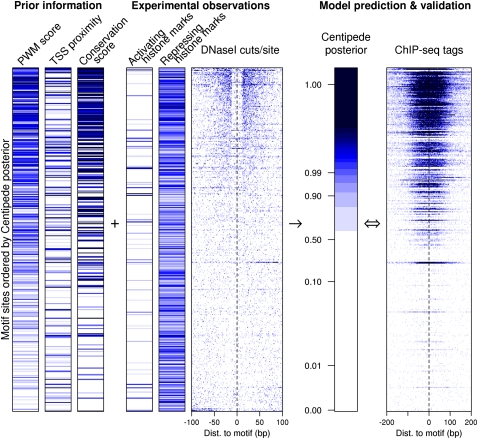
Figure 1.
Overview of the CENTIPEDE approach using the factor REST as an example. Each row in the image represents a genomic location that matches the primary REST binding motif. For each motif instance, we extracted prior information (PWM score, TSS proximity, and conservation score) and experimental data (histone marks and DNase-seq reads). Rows are ordered by the posterior probability given by the model (bound sites at the top) and, for validation only, compared to REST ChIP-seq reads extracted in a 400-bp window surrounding the motif (last column). Darker blue coloring indicates, in each column, respectively, higher PWM score; motif closer to the TSS; motif site more conserved; more histone ChIP-seq reads in 400-bp windows around each site; more DNase I cuts per site; higher CENTIPEDE posterior probability of binding; larger number of REST ChIP-seq reads per site. Notice that a 22-bp segment at the center of high posterior sites is protected from DNase I cleavage indicating DNA–protein binding. The plot shows 200 randomly selected motif sites with posterior probability > 0.5, and 200 with posterior < 0.5, respectively; this sampling procedure increases the fraction of bound sites displayed.

