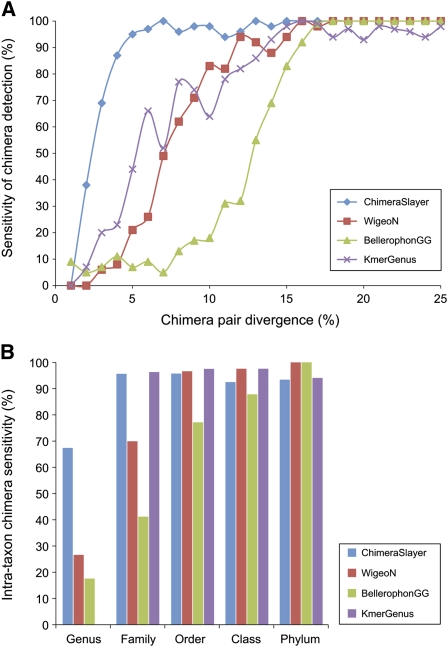
Figure 2.
Comparison of chimera detection sensitivity among methods. (A) Chimera detection sensitivity as a function of chimera divergence; (B) chimera detection sensitivity according to the shared level of taxonomy between the proposed parental sequences. Cumulative false-positive rates were as follows: CS, 1.6%; WigeoN, 0.67%; BellerophonGG, 7.13%; KmerGenus, 0%.

