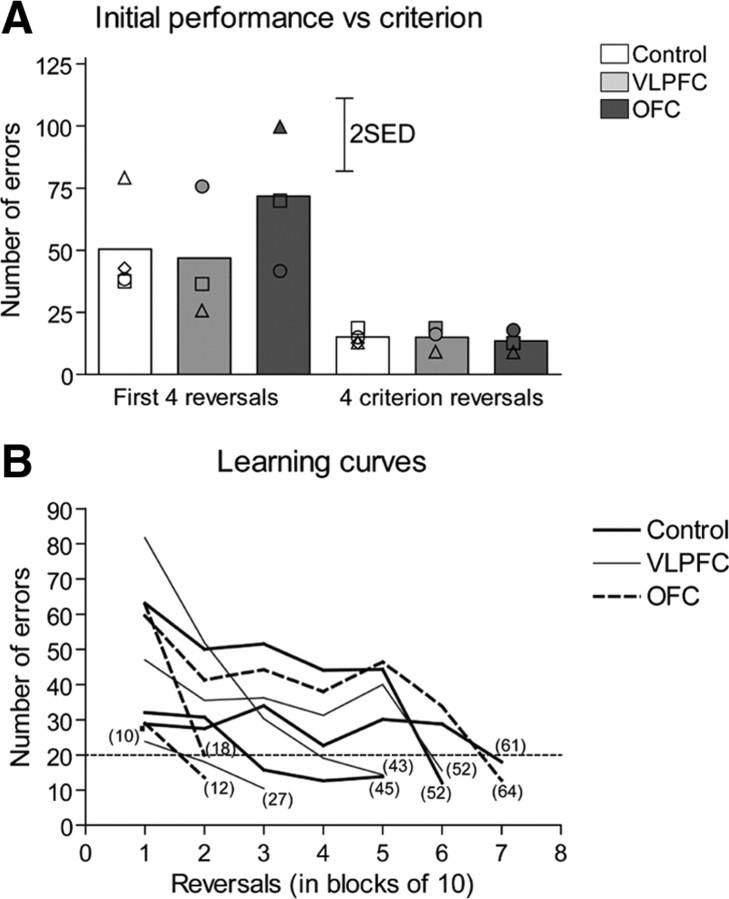
Figure 3.
Development of the learning set presurgery. A, Initial performance versus criterion. The bars represent the mean number of errors made by each experimental group of animals during four initial and four final presurgery criterion reversals. Scattered symbols represent the performance of individual animals within groups. SED, SE of the difference of the means. B, Learning curves. Lines represent learning curves of the individual animals in each experimental group. For clarity, the mean number of errors across blocks of 10 reversals is presented. It should be noted that for each animal, the final block represents <10 reversals, dependent upon the number of reversals an individual marmoset performed before reaching criterion. Numbers in parenthesis represent the total number of reversals for each marmoset. The single point in block 1 represents an animal in the control group that reached criterion after the first 10 reversals.

