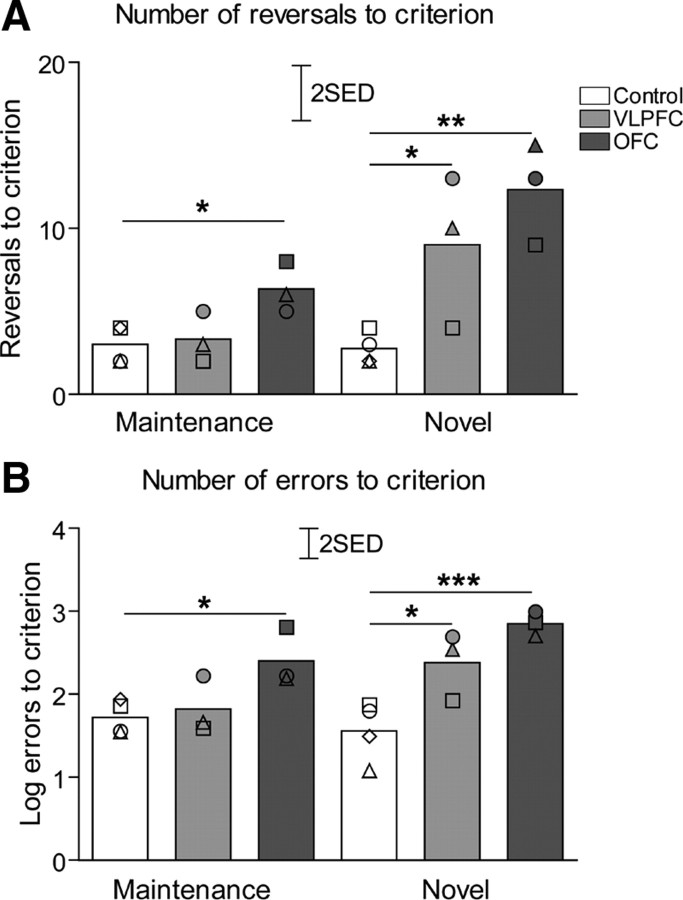
Figure 4.
Serial discrimination reversal performance postsurgery. A, The bars represent total numbers of reversals (mean for each group) performed by animals before reaching stable reversal performance during both postsurgery stages (maintenance and novel discrimination). B, The bars represent total numbers of errors (mean for each group, log transformed) during both postsurgery stages (maintenance and novel). Scattered symbols represent the performance of individual animals within groups. *p < 0.05, **p < 0.01, ***p < 0.001 compared with control group (LSD post hoc test). SED, SE of the difference of the means.

