
Figure 6.
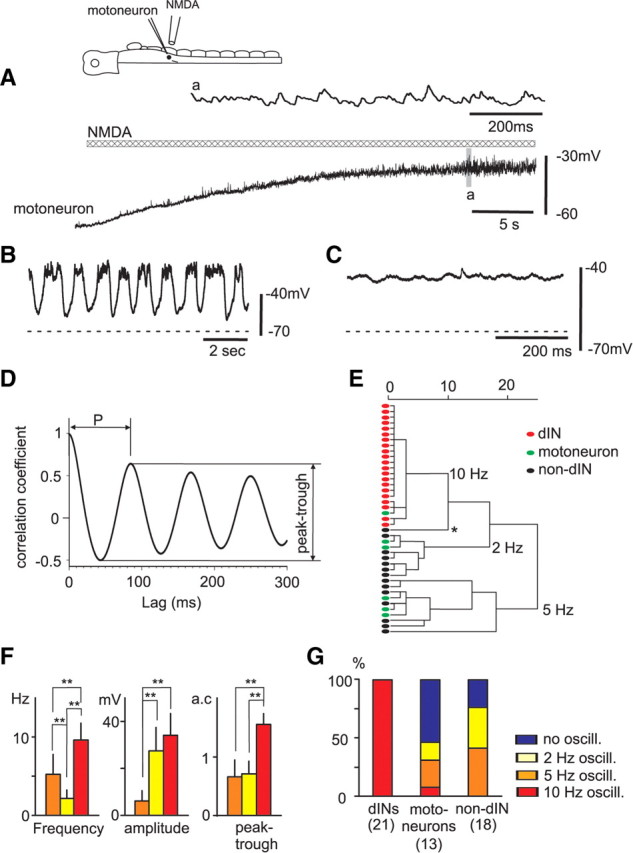
Comparison of responses of dINs and non-dIN neurons active during swimming to NMDA in TTX. A, A motoneuron only produced depolarization and increased noise. B, A non-dIN interneuron produced big, slow oscillations during NMDA-evoked depolarization. C, In another motoneuron, there were only small ∼10 Hz oscillations. The dashed lines indicate resting membrane potentials. D, Autocorrelation of oscillations in a dIN. The first autocorrelation peak period (P) and peak–trough difference are used for cluster analysis in E. E, Dendrogram of a cluster analysis result showing three clusters of neurons with oscillations at 10, 2, and 5 Hz. The asterisk (*) marks the one non-dIN interneuron with high-frequency unreliable big oscillations. F, Comparing the oscillation frequencies, amplitudes and autocorrelation peak-to-trough differences in the three clusters in E (**p < 0.01, ANOVA). G, The proportion of dINs, motoneurons, and non-dIN interneurons with oscillatory responses. The color coding in G also applies to F. For details, see main text. Error bars indicate SD.