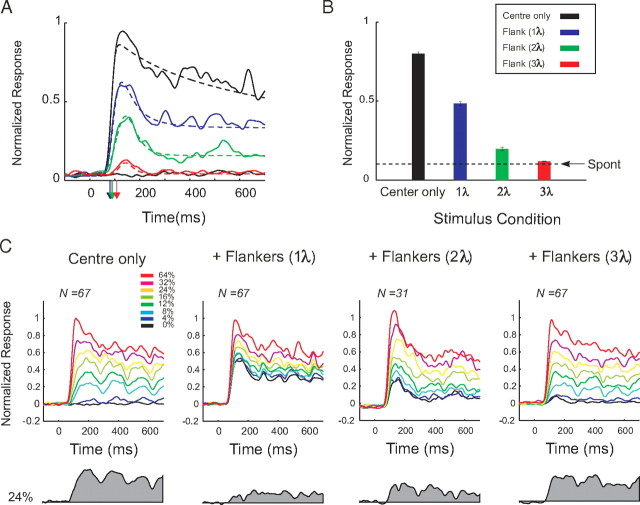
Figure 2.
Population analysis of the effects of collinear flankers in area V1. A, Comparison of the V1 population responses elicited by the central target to the response evoked by the flanker-only conditions. The dashed lines show the fit to the data used to compute the response latency that was defined as the time that the fitted function reached 33% of its maximum. The colored arrows on the x-axis denote onset latencies. B, Average responses in a window from 50 to 350 ms after the stimulus onset. Arrow, Ongoing activity in the same time window in the absence of Gabor stimuli. Error bars indicate SEM. C, Population responses evoked by the central stimulus alone or in the presence of the collinear flankers located at three distances (1, 2, and 3λ). The shaded gray area denotes the responses (Resptarget) evoked by a target contrast of 24%, after subtraction of the response evoked by the flankers.

