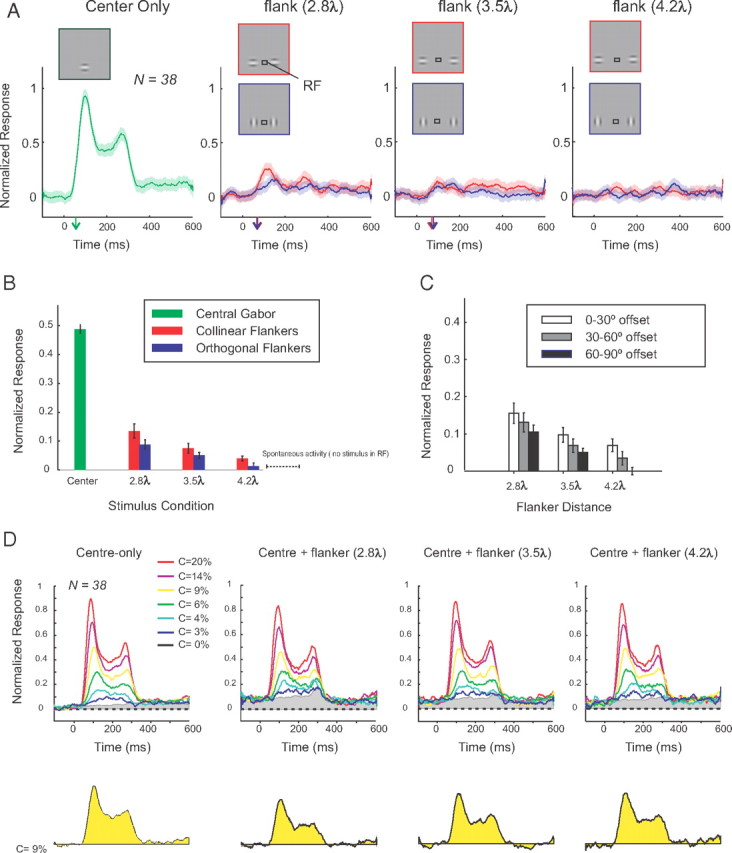
Figure 7.

Effects of flankers on the population responses in area V1. A, The neuronal responses evoked by a central target (green) are compared with the responses elicited by the collinear (red) and orthogonal flankers (blue) placed at three distances (2.8, 3.5, and 4.2λ). The arrows on the x-axis denote the response latencies. B, Average neuronal activity in a time window from 50 to 350 ms after stimulus onset (same data as in A). C, Activity induced by collinear flankers as a function of the difference between the presented and preferred orientation (0–30, 30–60, and 60–90°). Error bars indicate SEM. D, Responses evoked by the central target at different contrast levels. The yellow response shown below represents the difference between the activity evoked by a central Gabor with 9% contrast in the presence of flankers and the activity evoked by the flankers on target-absent trials. Note that the flankers reduce the response. Gray area in the upper panels shows neuronal activity in the absence of the central target stimulus.
