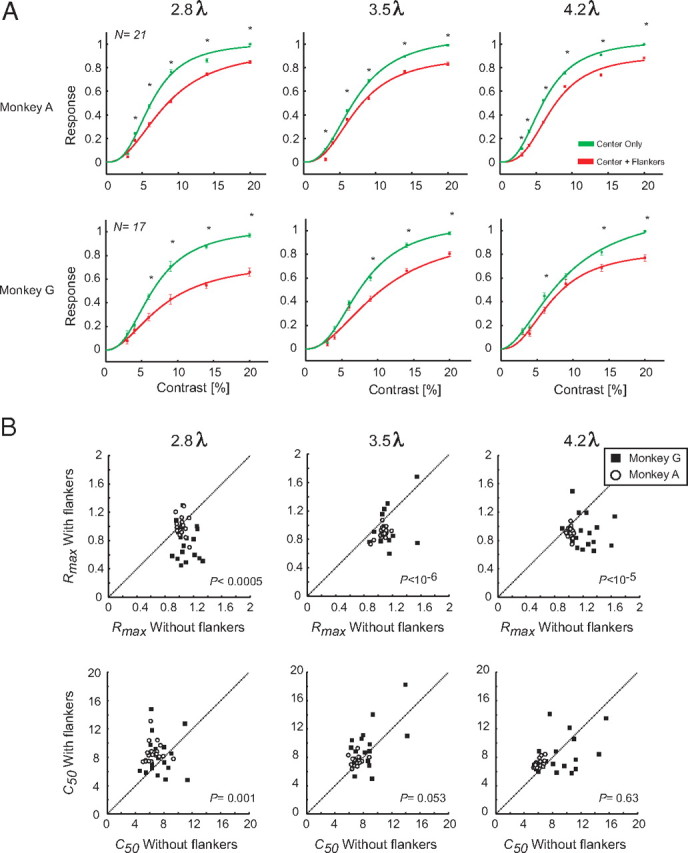
Figure 8.

Quantification of flanker modulation in a population of V1 recording sites. A, Contrast response functions averaged across all recording sites in the presence and absence of the flankers. The error bars represent the SEM. The asterisks (*) denote a significant difference in the response evoked by the target in the presence and absence of flankers (p < 0.05, Mann–Whitney U test with Bonferroni's correction for multiple comparisons). B, Distribution of Rtarget_max and c50 values derived from a hyperbolic fit to the responses of all V1 recording sites in the presence (ordinate) or absence (abscissa) of flankers. The values of p are computed with a paired t test.
