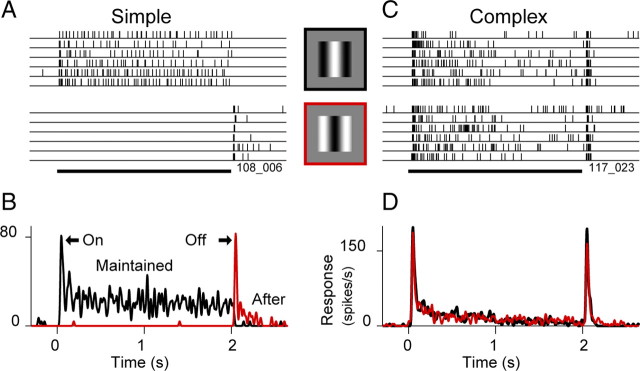
Figure 1.
Phase sensitivity and response components of simple and complex cells to static stimuli. A, Raster plots show responses of a simple cell (orientation-tuned, non-DS) to six trials of a static sine grating presented for 2 s at the phase that drove the cell most strongly (top rasters) and at the phase 180° opposite (bottom rasters). The visual stimuli (icons shown to the right of the rasters) were optimized for orientation, size, and spatial frequency. Eight spatial phases were tested, but only two are shown here. The black-outlined stimulus was defined as the preferred for this cell, and the red-outlined stimulus was defined as the anti-preferred. B, PSTHs of the response to the preferred and anti-preferred stimuli. The preferred stimulus (black) evokes a visible transient “on” response, followed by an MR. The ending of the anti-preferred stimulus (red) evokes a transient “off” response, followed by a weak AR. C, D, Formatted as in A and B, responses are shown for a complex cell (orientation-tuned, non-DS), which by definition is insensitive to stimulus phase. The stimulus at each phase evokes a response with a similar time course that contains an on-transient, MR, off-transient and a weak or absent AR.

