
Figure 6.
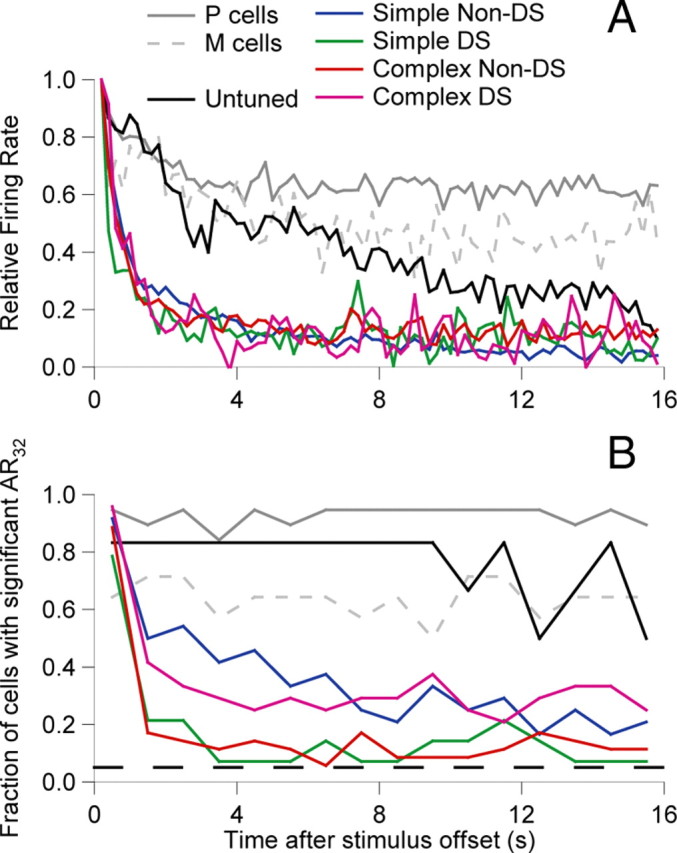
A, Population average PSTHs (bin size, 200 ms, no smoothing) for each cell class but including only those cells that did show an AR according to our standard criterion (firing rate significantly higher than spontaneous in the 500 ms period starting 150 ms after stimulus offset; n values as for Fig. 4). Before averaging, spontaneous rate was subtracted, and the values were normalized to the firing rate at the start of the after-response (200–600 ms). B, Normalized frequency histograms, showing the fraction of cells of each class with AR significantly above the spontaneous rate (p < 0.05) as a function of time. Significance tests were done for 1 s windows. The bottom dashed black line indicates the 5% significance level.