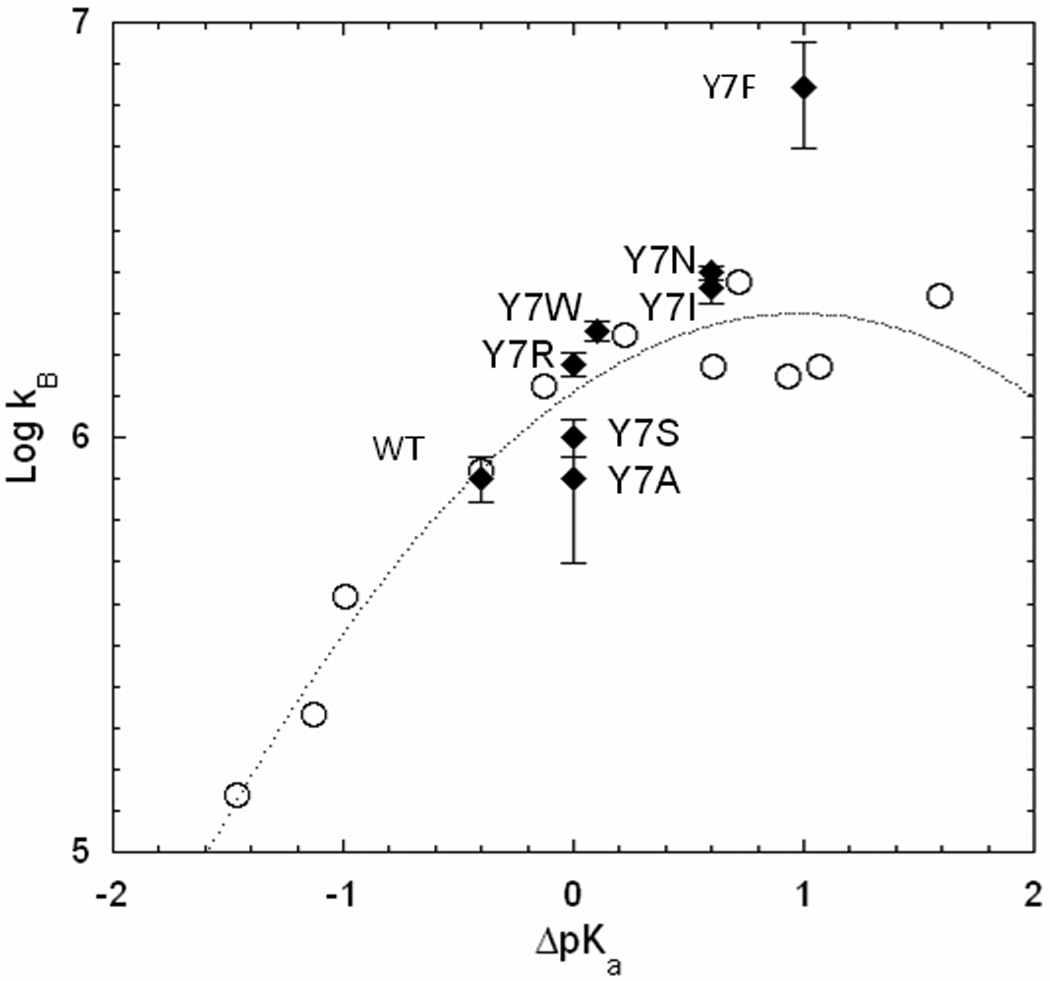
Figure 7.

Free energy plot of the logarithm of the rate constant for proton transfer kB (s−1) versus ΔpKa (pKa ZnH2O – pKa His64) determined from the RH2O/[E] pH profiles for the wild type and the mutants of HCA II containing replacements of Tyr 7 identified on the plot (♦ filled symbols); and (○) for H64A HCA II from An et al. [13] with proton transfer provided predominantly by derivatives of imidazole and pyridine acting as exogenous proton donors with the solid line a best fit of Marcus Rate Theory.
