
Fig. 3.
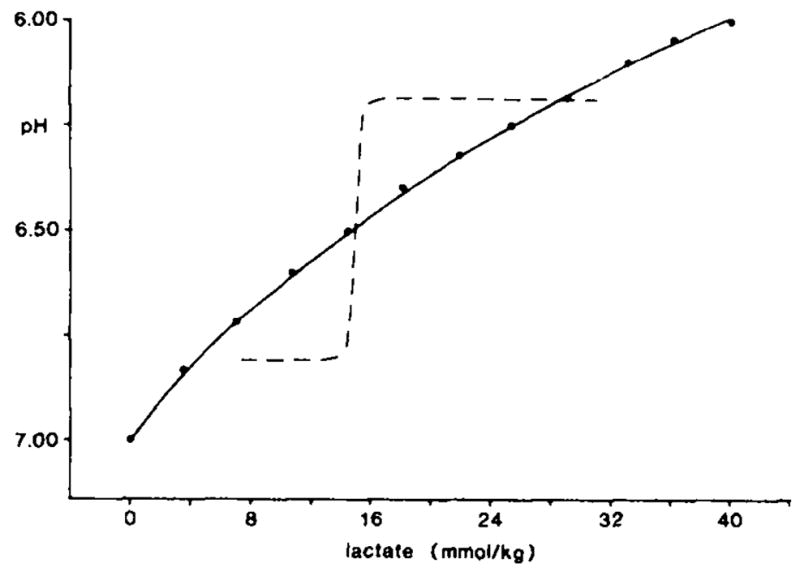
Titration of rat cerebral cortex homogenate. Solid line shows the change in pH produced when lactic acid (mmol/kg brain) was added to a homogenate of rat cerebral cortex in 100 mM sodium fluoride while under mineral oil. Note that [H+] rose steadily without an inflection. For comparison the data from Fig. 2 are superimposed here as a dotted line.