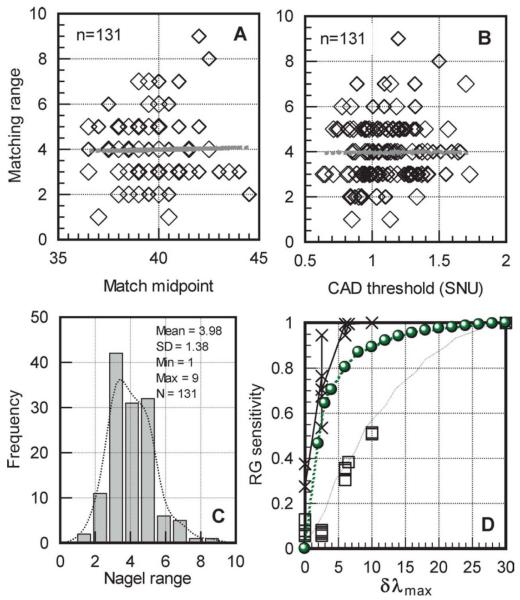
Fig. 5.
Section A shows the lack of correlation between match midpoint and matching range for 131 normal trichromats. The best-fit straight line is given by: y = 8.2757 - 0.1013 * x (r2 = 0.011). Section B shows the matching range in the same subjects plotted against the subject’s corresponding CAD threshold (expressed in standard normal units). There is again no correlation between the matching range and the subject’s measure of red-green chromatic sensitivity (y = 3.318 + 0.768 * x; r2 = 0.011). Section C shows the distribution of the matching range in the same group of normal trichromats. The matching range can vary from as small as one unit, in the subject with the highest red-green discrimination, to nine units in the subject with the worst discrimination. Section D plots measures of red-green chromatic discrimination sensitivity for the 15 subjects with deutan like deficiency listed in Table 1. The same index (i.e., RGI = 1-(R-MR)/73) is used to define chromatic sensitivity for both model predictions and measured anomaloscope matches. The crosses plot the subject’s measured chromatic sensitivity index (RGI) based on individual Nagel matches. The open squares show the measured rg sensitivity for the same subjects based on their CAD rg thresholds. The green disc symbols plot RGI values based on the matching range predicted by the model (when the only parameter that changes is δλmax).

