
Figure 2.
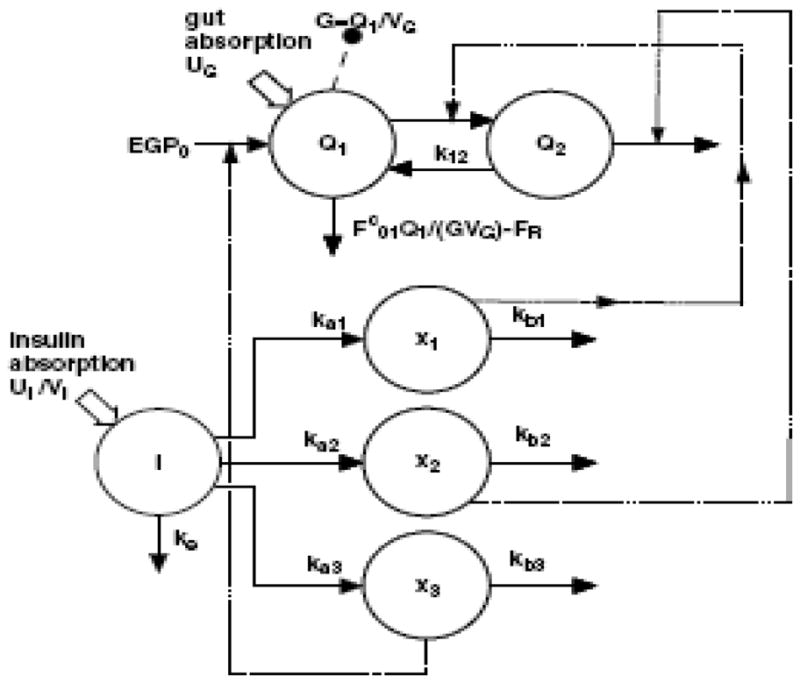
Pharmacokinetic diagram from Hovorka model [43]. Q1 and Q2 represent the mass of glucose in compartments 1 and 2, respectively. I represents plasma insulin, and x1, x2, and x3 represent insulin action toward glucose uptake, production, and exchange between the two compartments. Solid lines represent kinetic appearance or disappearance. Dashed lines represent action by insulin. Large solid arrows represent a single non-continuous source of either glucose or insulin.