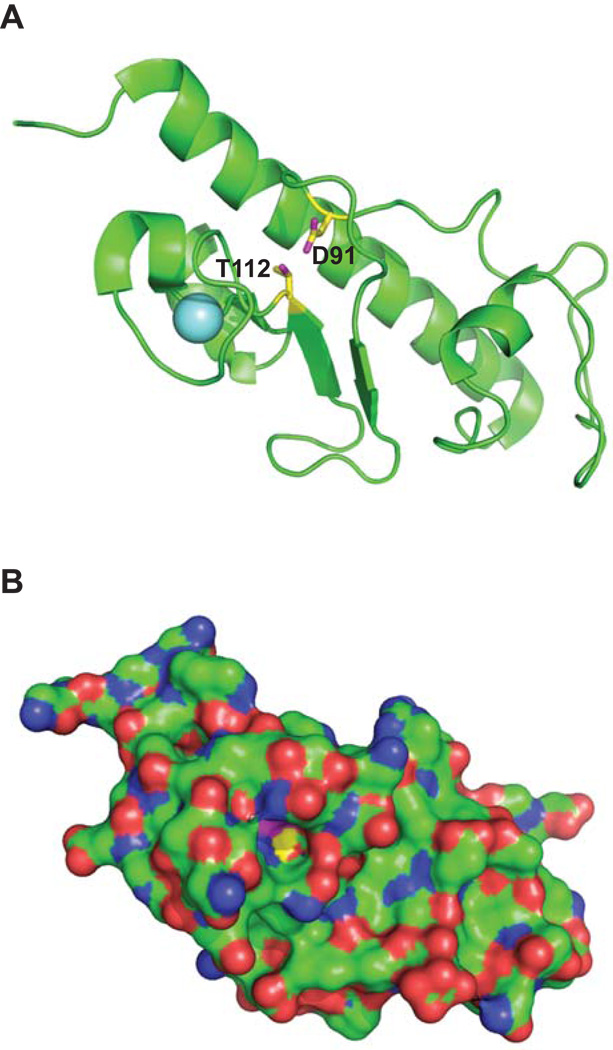
Figure 6. Location and interaction between residues Asp91 and Thr112 in EpsG.
V. cholerae EpsG (Korotkov et al., 2009; PDB code 3FU1) depicted with the side chains of D91 and T112 colored with yellow carbons and magenta oxygens. The light blue sphere is a bound calcium ion. (A) View approximately perpendicular to the EpsG helix axis with the backbone cartoon in green and the side chains of D91 and T112 as sticks. (B) Surface representation of the same view with the side chains of D91 and T112 with the same color code as in Panel A, the other atoms are colored green for carbons, blue for nitrogens and red for oxygens. A deep cavity is apparent where only a few atoms of D91 and T112 are visible. Figure prepared with PyMOL (DeLano, 2002).

