
Fig. 1.
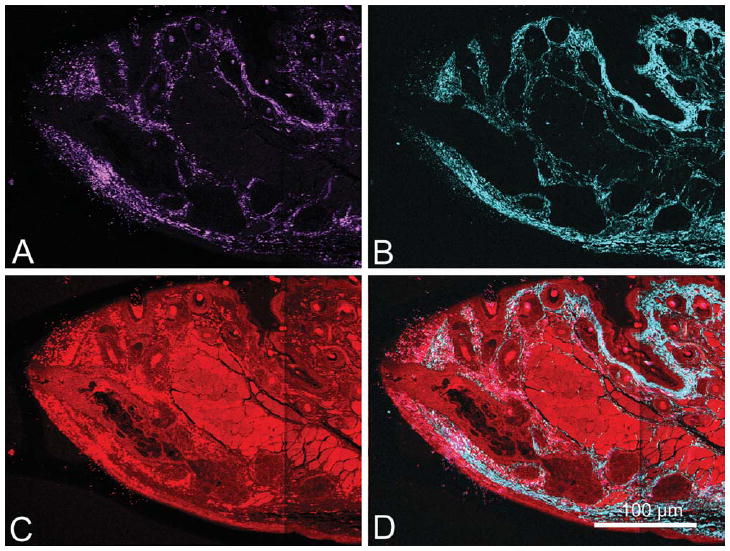
LR White section (2-μm thick) of 2-month-old mouse MG imaged using 800 nm femtosecond laser excitation to simultaneously generate SHG and TPEF signals. Each image represents a tiled scan with a resolution of .44 μm per pixel. SHG and TPEF signals were collected and displayed as individual pseudo-colors; the backscattered SHG channel is shown in magenta (A), forward scattered SHG channel is shown in cyan (B), TPEF signal is shown in red (C), and a merged image of all channels is also shown (D).