
Fig. 5.
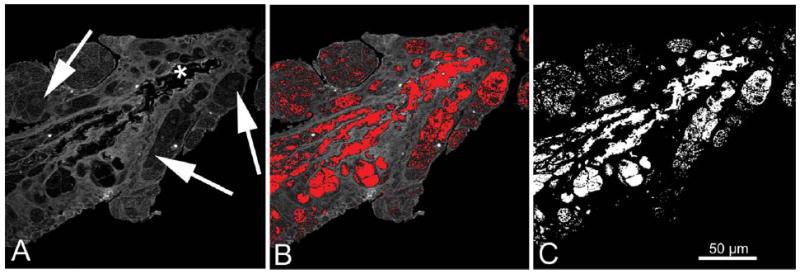
Extraction of the lipid volume from the TPEF channel image. In the TPEF MG image, two levels of signal were detected; a high-intensity signal from the cellular structures (ductal epithelium and acini), and a low-intensity signal from the ductal lumen (A, asterisks) and acinar vesicles (A, arrows) that represents lipid. The mean pixel intensity of the ductal lumen was measured and used as a threshold to segment out the lipid area from the cellular area (B, red pixels are below threshold value and therefore sectioned out). This process results in an image showing only pixels that represent either ductal lumen or acinar lipid (C).