
Fig. 6.
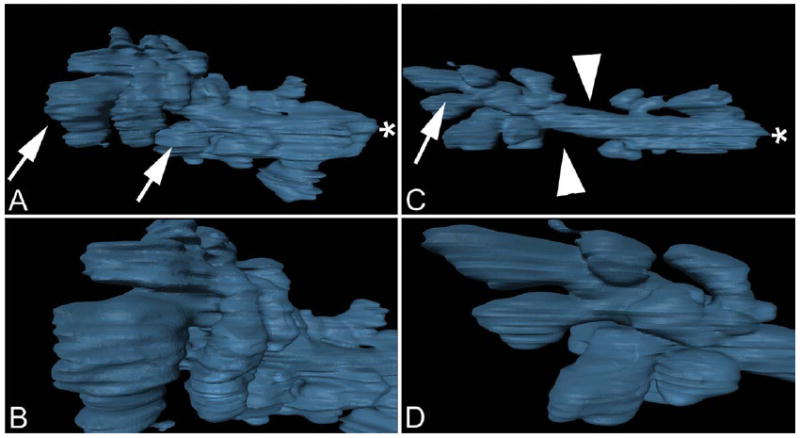
Meibomian gland three-dimensional surface rendering. Two-month-old gland (A, B). Frame A depicts the entire gland surface, arrows identify large acini, asterisks indicates gland orifice. Frame B depicts a closer inspection of acini at the distal end of the gland. Two-year-old gland (C, D) shows regions were acini were missing (arrowheads) or reduced in size (arrow).